

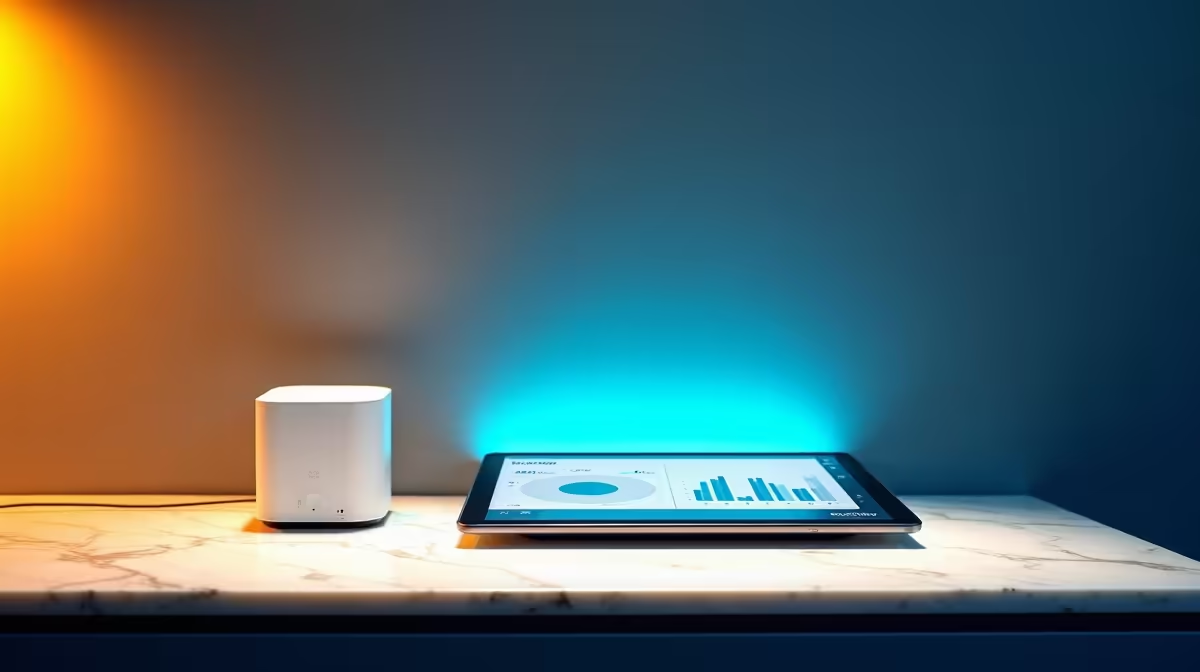
You cannot trim an electricity bill you cannot see. The Home Assistant Energy Dashboard turns vague worry about your Eskom account into a clear picture of which devices actually draw the power, and with your tariff entered, what each one costs in rand. The setup hinges on one thing: a sensor that reports cumulative kilowatt-hours in the right format. Get that part correct and the rest is a few clicks under Settings.
Quick Answer
Set up the Energy Dashboard by adding a cumulative kWh sensor under Settings, Dashboards, Energy. The sensor must report in kWh with a state class of total_increasing. Enter your rand-per-kWh Eskom tariff and the dashboard shows per-source cost, not just usage. Allow up to an hour for the long-term graphs to fill.
Step 1: Get a power monitoring device
The dashboard needs something measuring actual consumption. You have two broad routes.
- Whole-home monitoring with a clamp meter on your mains, which reports total household draw. This gives you the full picture in one sensor.
- Per-device smart plugs that measure the consumption of whatever is plugged into them, ideal for pinning down the cost of a specific appliance like a geyser circuit, a fridge, or a gaming PC.
Many households start with a couple of smart plugs on suspected energy hogs and add whole-home monitoring later. Check what is currently stocked in the Evetech smart home and appliances section to find the right monitoring device for your setup.
Step 2: Integrate the device and check the sensor
Add your monitoring device to Home Assistant under Settings, Devices and Services. Once it appears, confirm its energy sensor exposes the right attributes, because this is where most setups go wrong. Open Developer Tools, States, and find the sensor. It needs three things:
- unit_of_measurement set to kWh
- state_class set to total_increasing
- device_class set to energy
The total_increasing part matters most. The Energy Dashboard wants a cumulative meter reading that only goes up, not an instantaneous wattage figure. If any attribute is missing, you can add it by customising the entity in your configuration. A power sensor that reports watts rather than cumulative kWh will not appear as an option, which trips up a lot of first-time setups.
Step 3: Open the Energy configuration
Go to Settings, Dashboards, Energy. This is the dedicated configuration screen for the dashboard. Here you tell Home Assistant which sensors represent your grid consumption, and optionally solar, battery, and individual devices.
Step 4: Add your grid consumption
Under the Electricity Grid section, click Add consumption and select your kWh sensor, the one with total_increasing. If you have solar, this is also where you add Return to grid, Solar production, and a Home battery. For a basic setup tracking what you pull from the grid, the single consumption sensor is all you need to get started.
Step 5: Enter your Eskom tariff for cost tracking
This is the step that turns kilowatt-hours into rand. When adding the consumption sensor, choose to attach a price. The simplest option is a static price: enter your rand-per-kWh rate from your Eskom or municipal tariff and the dashboard calculates cost in rand automatically.
If your tariff changes by time of day, you can represent the current price with an input_number or a template sensor and feed that to the dashboard, then use automations to update the price as the schedule changes. For a flat rate, the static price is quicker and perfectly adequate.
Step 6: Add per-device sensors and wait for data
If you fitted smart plugs to individual appliances, add each one under Individual devices so the dashboard breaks down where your power actually goes. Then be patient: the real-time cards work immediately, but the long-term statistics graphs can take up to an hour to populate. Once they do, you get a clear daily and monthly view of consumption and cost per source. For cabling, adaptors, or extra plugs to expand coverage, browse the popular accessories at Evetech to pick up what you need.
Frequently Asked Questions
Why does my sensor not appear in the Energy Dashboard?
The dashboard only accepts a cumulative kWh sensor with a state class of total_increasing. A sensor reporting instantaneous watts will not show up. Check the entity in Developer Tools, States, and add the kWh unit, total_increasing state class, and energy device class if any are missing.
How do I track cost in rand rather than just kWh?
When you add your consumption sensor, attach a price. Enter your rand-per-kWh Eskom or municipal rate as a static price and the dashboard converts usage into cost automatically. For varying rates, use an input_number or template sensor for the current price.
How long until the dashboard shows data?
Real-time cards work straight away, but the long-term statistics graphs can take up to an hour to populate. If the graphs look empty just after setup, give it time before assuming something is wrong.
Can I track individual appliances?
Yes. Fit a smart plug with energy monitoring to the appliance, add it to Home Assistant, then list it under Individual devices in the Energy configuration. The dashboard then breaks down consumption and cost per device, which is the best way to find an energy hog.
Do I need solar to use the Energy Dashboard?
No. Solar, battery, and return-to-grid sources are optional. A single grid consumption sensor is enough to track what you pull from the grid and what it costs, and you can add solar later if you install it.
Want to see exactly where your electricity rand go each month? Set up monitoring with hardware from the smart home and appliances range at Evetech and start tracking your usage by device.