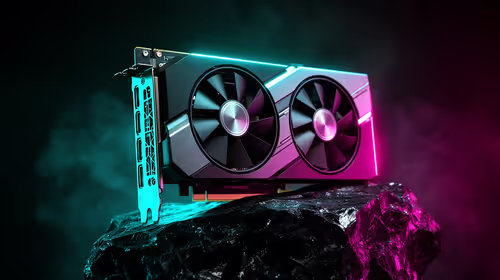



A new temperature box can look like a new problem. GPU-Z 2.71.0 adds RTX 50 hot-spot and memory readings, giving owners more detail about hardware they already have. The useful response is to compare those readings properly. Replacing fans or opening a graphics-card cooler because a previously hidden number looks high is an expensive way to skip the diagnosis.
Quick Answer
The update adds RTX 50 hot-spot reporting and shows the hottest memory chip, with individual memory readings available in the tooltip. GPU-Z is free, so checking the new information costs R0. Compare the same sensor under the same workload before deciding whether a cooling change is needed; a hot-spot number is not interchangeable with an ordinary GPU reading.
🌡️ Name the sensor before judging it
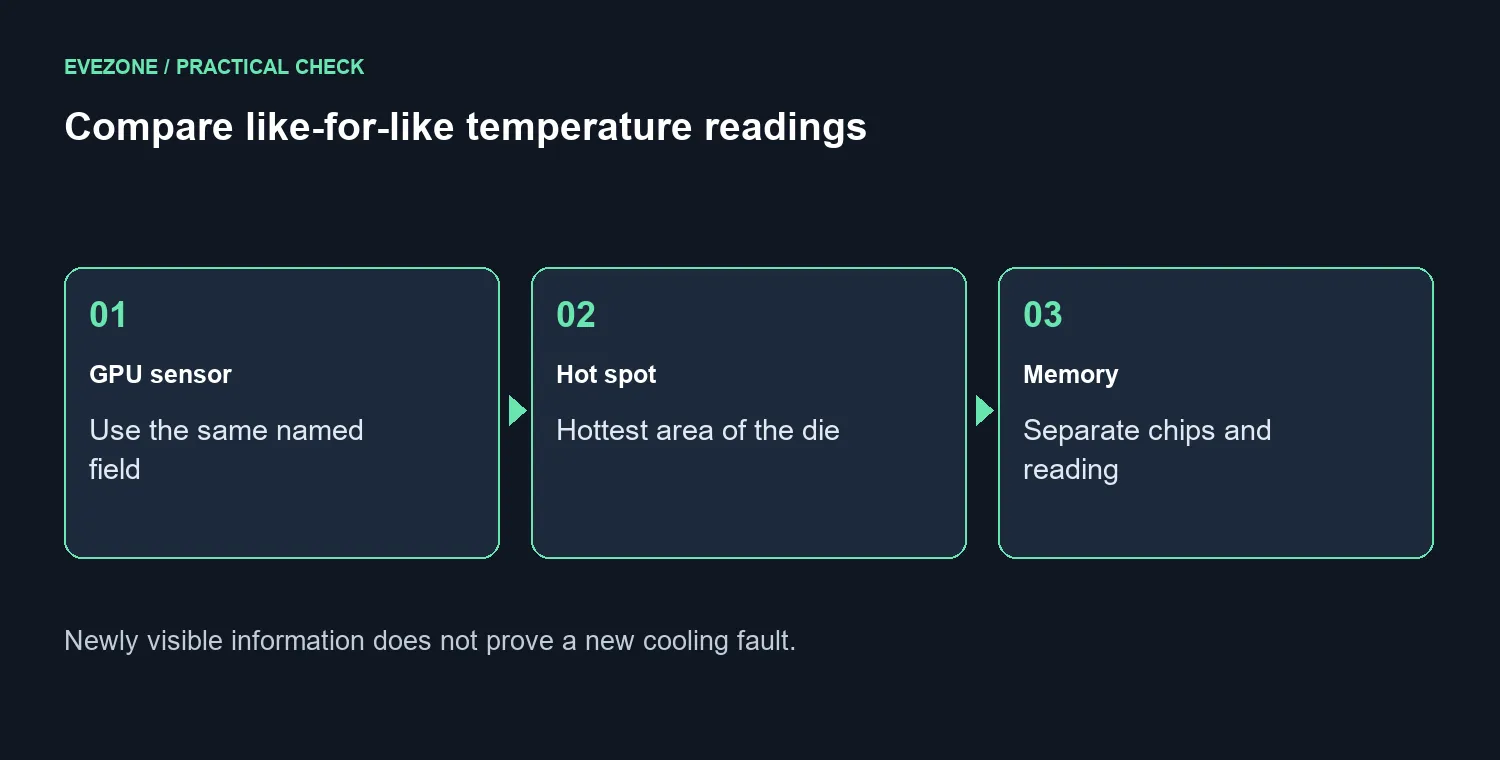
Hot spot refers to the hottest measured area of the GPU die. Memory temperatures describe separate chips. If yesterday's screenshot showed one field and today's screenshot shows another, the difference is not a valid before-and-after cooling test. Label any saved screenshot or log with the software version and sensor name so you can interpret it later.
The memory tooltip is useful because the default value represents the hottest reported chip. Looking at the individual values can provide context, but this release does not supply a universal acceptable difference for every card. Use the exact model's guidance and support route when a repeatable measurement concerns you. Do not import a threshold from an unrelated board.
📊 Make the comparison repeatable
Choose a familiar game scene or repeatable workload and keep its settings unchanged. Record whether the PC is idle or loaded, how long the test ran, and whether the room conditions are comparable. A short desktop reading after a cold start is a poor comparison for a warm system after a lengthy gaming session.
Check that the sensor you want is actually being logged. The release notes say a greyed dropdown arrow identifies a sensor excluded from file logging. A missing column in a log therefore deserves a settings check before it becomes a hardware conclusion. Repeat the observation before changing a fan curve, a power setting or any other variable.
🧰 Spend only after finding a cause
Inspect the easy things first: blocked vents, dust filters and whether the existing fans operate normally. Switch off and disconnect the PC before physical inspection, and avoid opening the graphics-card cooler as an exploratory first step. If crashes or visual faults accompany unusual readings, save the evidence and contact support for the exact card.
The graphics-card range is useful when you have a genuine upgrade requirement, not merely a new number on screen. Likewise, case fans should address a known airflow limitation. The R0 monitoring step may show that the system is behaving as before, or it may produce a clearer support report; neither outcome requires buying something immediately.
Frequently Asked Questions
What temperature support is new?
The release adds RTX 50 GPU hot-spot readings and memory-chip temperature reporting.
Which memory temperature appears first?
The hottest memory chip is shown by default. Hovering reveals the reported temperatures for the other memory chips.
Is hot spot the same as ordinary GPU temperature?
No. It describes the hottest measured area of the die, so comparing it directly with a different sensor is misleading.
Does the update make my graphics card faster?
It adds information and fixes. New monitoring fields do not themselves prove an increase in game frame rates.
Should I repaste a card after one high value?
No. Repeat a controlled test, check the model guidance and use support before opening the cooler.
Does GPU-Z charge for ordinary use?
GPU-Z is free for personal and commercial use. Redistribution and SDK licensing are separate matters.
Ready to check before changing your cooling? Use repeatable measurements to guide any Evetech graphics or airflow purchase, and keep support evidence for the exact card.