


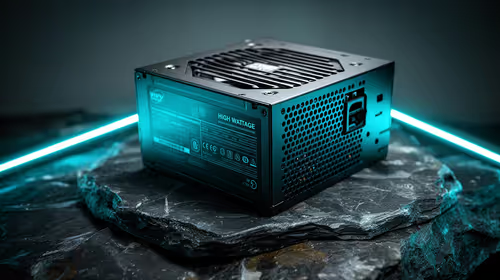
550W PSU Planning for RTX 5080 Super Builds in SA
550W for RTX 5080 Super needs a full-build check, not a simple yes. Review GPU guidance, CPU draw, transient load, connectors, PSU quality, and upgrade plans before deciding.
Read moreA graphics card's average frame rate can look smooth on paper while hiding stutter, which is why the 1% low figure, the average of the worst frames, matters just as much. Reading a frame time graph in milliseconds alongside both shows the spikes averages hide.
Average FPS can hide a game that feels rough. If most frames are fast and a few take much longer, the average stays healthy while you notice hitches. One-per-cent lows and a frame-time graph expose that uneven delivery.
Use average FPS for broad speed, one-per-cent lows for the slow tail, and frame time for the shape and timing of each hitch. Run the same benchmark several times after shaders have warmed. Compare the full trio, since no single number can explain every pacing problem.
Once the limit is known, compare upgrade candidates across Evetech's GeForce catalogue and its wider graphics-card favourites. A stronger card helps a GPU-bound low; it may do little for a traversal stall or saturated CPU thread.
Benchmark tools order or analyse the captured frame times and summarise the slowest portion. The precise calculation differs between tools, so treat results from separate applications with care. It is not always the literal average of the worst one per cent under every method.
One-per-cent lows remove much of the flattering effect of fast frames. A game averaging 120fps with a 45fps low can feel worse than one averaging 100fps with a steady 80fps low.
Very rare events may show up in a 0.1 per cent low, though that figure becomes noisy in a short capture. Longer, repeatable runs produce more useful tails.
FPS is a rate; frame time is the duration of one frame. At 60fps the ideal interval is about 16.7ms. At 120fps it is about 8.3ms. A graph makes a 40ms spike visible at the exact point where the game hitched.
Use the graph to classify the pattern. Evenly high frame times suggest a steady performance limit. Regular spikes can point to background polling or a cap problem. Spikes at new areas may involve shader compilation or asset streaming.
Keep the route, save, settings and capture length fixed. Close background updates and let launch-time shader work finish. Run at least three passes, discard an obvious interrupted run and report the spread rather than choosing the prettiest result.
Check GPU utilisation, CPU core load and VRAM beside frame time. The relationships tell you whether to lower graphics settings, investigate the processor or wait for a game patch.
Yes within the same sound test, because it means the slow portion completed faster. Different tools or runs still need context.
Their frame-time variation, input path, engine and display presentation can differ despite matching averages.
They can reveal rare stalls, but capture length and run-to-run variation make them noisy. Pair them with the graph.
Capture the same route three times, read average FPS beside one-per-cent lows and use the frame-time graph to find when each hitch begins.
Yes within the same sound test, because it means the slow portion completed faster. Different tools or runs still need context.
Their frame-time variation, input path, engine and display presentation can differ despite matching averages.
They can reveal rare stalls, but capture length and run-to-run variation make them noisy. Pair them with the graph. {{PRODUCTS: { facets: { query: "gaming GPU for stable frame rates" }, limit: 12, title: "Compare GPUs for Smooth Gaming", style: "4" } }}
550W for RTX 5080 Super needs a full-build check, not a simple yes. Review GPU guidance, CPU draw, transient load, connectors, PSU quality, and upgrade plans before deciding.
Read more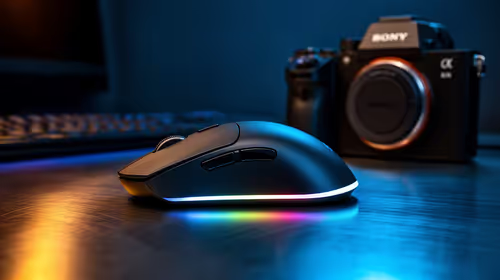
8000Hz polling is overrated for most SA gamers because gains can be tiny next to battery drain and monitor limits. Mbombela players should weigh mouse feel, game support, and system stability before chasing the number.
Read more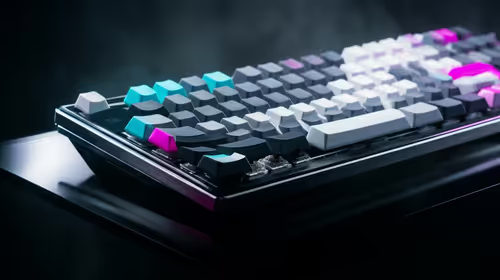
Magnetic switches are taking over SA gaming keyboards because actuation can be tuned. For Sandton gamers, rapid trigger, reset control, and profile depth can help, but layout, key feel, and software quality still matter.
Read more
Polokwane oled monitor value questions need cautious SA context because pricing can move with availability, exchange rates, specs, and warranty support. Treat the trend as a planning signal, not a fixed price promise.
Read more
Arc B580 budget builds for Midrand gamers can shift with exchange rates, supply, specs, and model tier. Treat the title as a buying prompt, then compare SA warranty, timing, and build priorities.
Read more
ROG Ally X may beat the LCD Steam Deck for SA gamers who value stronger handheld performance, more memory, and Windows flexibility. Compare battery life, controls, game libraries, and Polokwane support needs before deciding.
Read more
Minisforum's M2 Pro pairs Core Ultra X7, Arc B390 graphics and 32GB onboard memory in 1.8 litres. SA buyers should weigh its fixed memory and $1,439 launch offer against local mini PCs.
Lenovo says Legion Go failures linked to BIOS N3CN42WW are not user error. Affected SA owners should stop retrying the update, preserve proof and open a support case.

Smart monitors can add apps and convenience, but they also add privacy settings and unwanted-software risk. SA buyers should audit the operating system before paying for extras.
A fake 113GB GTA VI ISO reportedly used empty padding around a small malware payload. SA gamers should delete unofficial builds, keep Windows security active and wait for official channels.
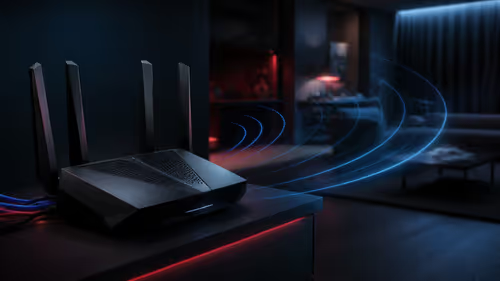
ASUS calls the ROG GT-BN98 the first Wi-Fi 8 gaming router. SA buyers should fix coverage and client limits before paying for a future wireless standard.
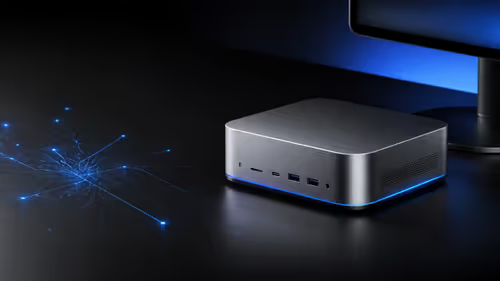
Apple's M6 Mac mini adds faster AI, graphics and networking in the same compact format. SA buyers should wait for a rand listing before comparing value.
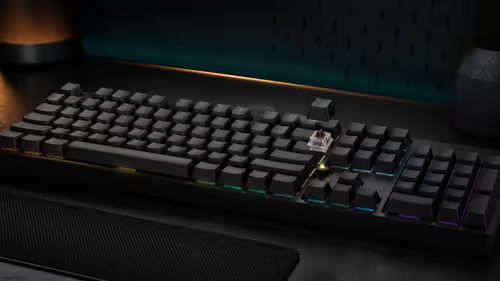
The Vulcan II XP adds hot-swappable switches, sound damping and gaming controls to a full-size wired board. SA buyers should compare feel before features.

Microsoft says Windows on Arm now has over 7,000 verified apps and games. SA buyers should still check each driver, game and work tool before switching.

Xbox Insiders can test disc-to-digital from 31 August 2026. Supported Xbox One and Series X discs gain a digital entitlement, but older discs, regions and title coverage still need exact checks.

ViewSonic's XG2738 pairs QHD QD-OLED with 240Hz and automatic panel care. SA buyers should compare warranty, brightness, ports and burn-in protection against today's R9,999-plus OLED shelf.

NVIDIA's final Windows 10 Game Ready driver is due in October 2026. SA gamers can keep using their GPU, but new game optimisations move on while critical security fixes continue quarterly.

JBL's new Quantum 520, 520X and 120 headsets cover wireless, Xbox-certified and wired use. SA buyers should compare connection, comfort and microphone needs before paying for a new badge.