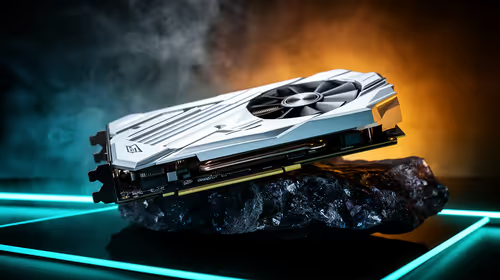
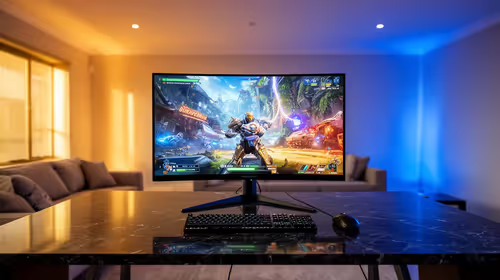
A dedicated GPU can be active while the 3D viewport still feels slow. Geometry evaluation, scene updates, CPU preparation, storage and application settings may all affect the path from input to screen. Treat a slow 3D viewport as a diagnosis problem: reproduce it, isolate the stage and change one condition at a time.
Quick Answer
The RTX A1000 has substantial viewport resources: 2,304 CUDA cores, 8GB GDDR6 and 192GB/sec bandwidth. A slow 3D view should first be separated into GPU, memory and scene causes.
Confirm the application has selected the intended GPU, then repeat one slow viewport action while observing the entire system. On this R12,099 card, Ampere contains 2304 CUDA cores. The memory side combines 8GB GDDR6 with a 128-bit interface. Neither resource can diagnose the viewport delay by itself.
🧭 Reproduce the delay precisely
Choose one camera movement, selection action or display-mode change that reliably triggers the issue. Save a copy of the project and note the application version, viewport mode, resolution and any active effects. A repeatable symptom is easier to diagnose than a general impression.
Restart the application and run the same action. If the problem changes without altering the file, background tasks or cached state may be involved. If it remains consistent, continue with controlled project and system checks.
🧭 Reduce scene complexity methodically
Hide one group of objects, lower one temporary viewport setting or disable one effect, then repeat the action. Do not permanently reduce the final deliverable while testing. The purpose is to identify whether geometry, textures or a particular display feature changes responsiveness.
Watch graphics-memory behaviour alongside application messages. An 8GB capacity can be enough for one scene and constrained by another. A memory limit is only one possibility, so avoid buying a larger card until the project test points in that direction.

🧭 Confirm device use and software support
Check the application's GPU selection, supported hardware guidance and any setting that enables acceleration. CUDA resources help only where the software uses them. A viewport operation may rely on a different path from the final renderer, which is why render speed should not be used as a proxy.
The A1000's 2304 CUDA cores sit within an Ampere design. Its 8GB GDDR6 uses a 128-bit interface. If testing indicates a graphics constraint, compare this R12,099 card through Evetech's workstation GPU range, keeping the troublesome scene and settings constant.
🧭 Inspect the rest of the workstation
Observe CPU load, system memory and storage activity during the same viewport action. A GPU replacement cannot remove a bottleneck that occurs while the CPU rebuilds geometry or data is fetched. Resolve the measured limit rather than the most visible component.
For workflows that mix 3D with AI-assisted tasks, the AI PC collection can support a whole-platform review. Consider the RTX A1000 when diagnosis points to its 8GB capacity or 2304-core CUDA configuration.
Use a viewport fault log
Capture the time, file, display mode, visible symptom and last user action whenever the slowdown appears. Add whether a restart, hidden object group or changed effect altered the behaviour. A short sequence of entries can reveal a project-specific pattern that one test misses.
Keep the log focused on observable events. Avoid entries such as "GPU weak" until device use and system behaviour support that conclusion. The log can also help a software support team reproduce the issue before any hardware is changed.
Capture a short screen recording when the fault is visible. Movement, delay and display mode can be easier to compare on video than through a written description alone.
The card also includes 18 RT cores and reaches up to 13.2 TFLOPS of ray-tracing performance where the application uses that path. Its 72 Tensor cores serve different supported operations. If monitoring shows the A1000 is selected and the project remains within memory, inspect geometry, effects and the rest of the workstation rather than assuming that the dedicated GPU lacks professional capability.
Frequently Asked Questions
Why can a viewport stay slow with a GPU?
The application may be waiting on CPU geometry work, memory, storage, scene updates or a software path that does not use the card as expected.
What should be tested first?
Repeat one slow movement with an unchanged file and settings. Confirm device selection before simplifying the scene or changing hardware.
Could graphics memory be involved?
Yes, particularly with larger geometry or texture working sets, but observe project behaviour and memory demand rather than assuming capacity is the cause.
Does 2304 CUDA cores prove viewport speed?
No. Core count does not state how a specific viewport engine uses the GPU or how other workstation components affect interaction.
Ready to isolate the cause of a stubborn 3D viewport?
Diagnose one repeatable scene action first, then compare Evetech workstation GPUs only if the evidence points to graphics resources.