Low latency and synchronized presentation are related design goals, but they are not synonyms. Hardware Genlock and Frame Lock provide coordination functions; an end-to-end delay result belongs to the complete source, graphics, signal and display path. Keeping that distinction clear prevents a feature name from becoming an unmeasured performance promise.
Quick Answer
Hardware Genlock and Frame Lock keep timing and frame presentation coherent across professional GPU outputs; RTX PRO Sync scales that coordination to large display installations.
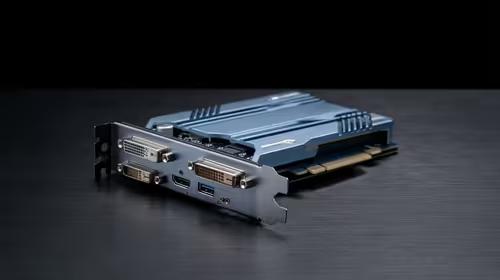
Genlock provides reference-timing coordination. Frame Lock is responsible for coherent frame presentation when multiple graphics resources participate. The R19,599 PNY RTX Pro Sync card includes those roles plus Mosaic. Its scale caps appear as 32 screens and eight GPUs; neither replaces a project-specific latency measurement.
⏲️ Understand what hardware synchronization does
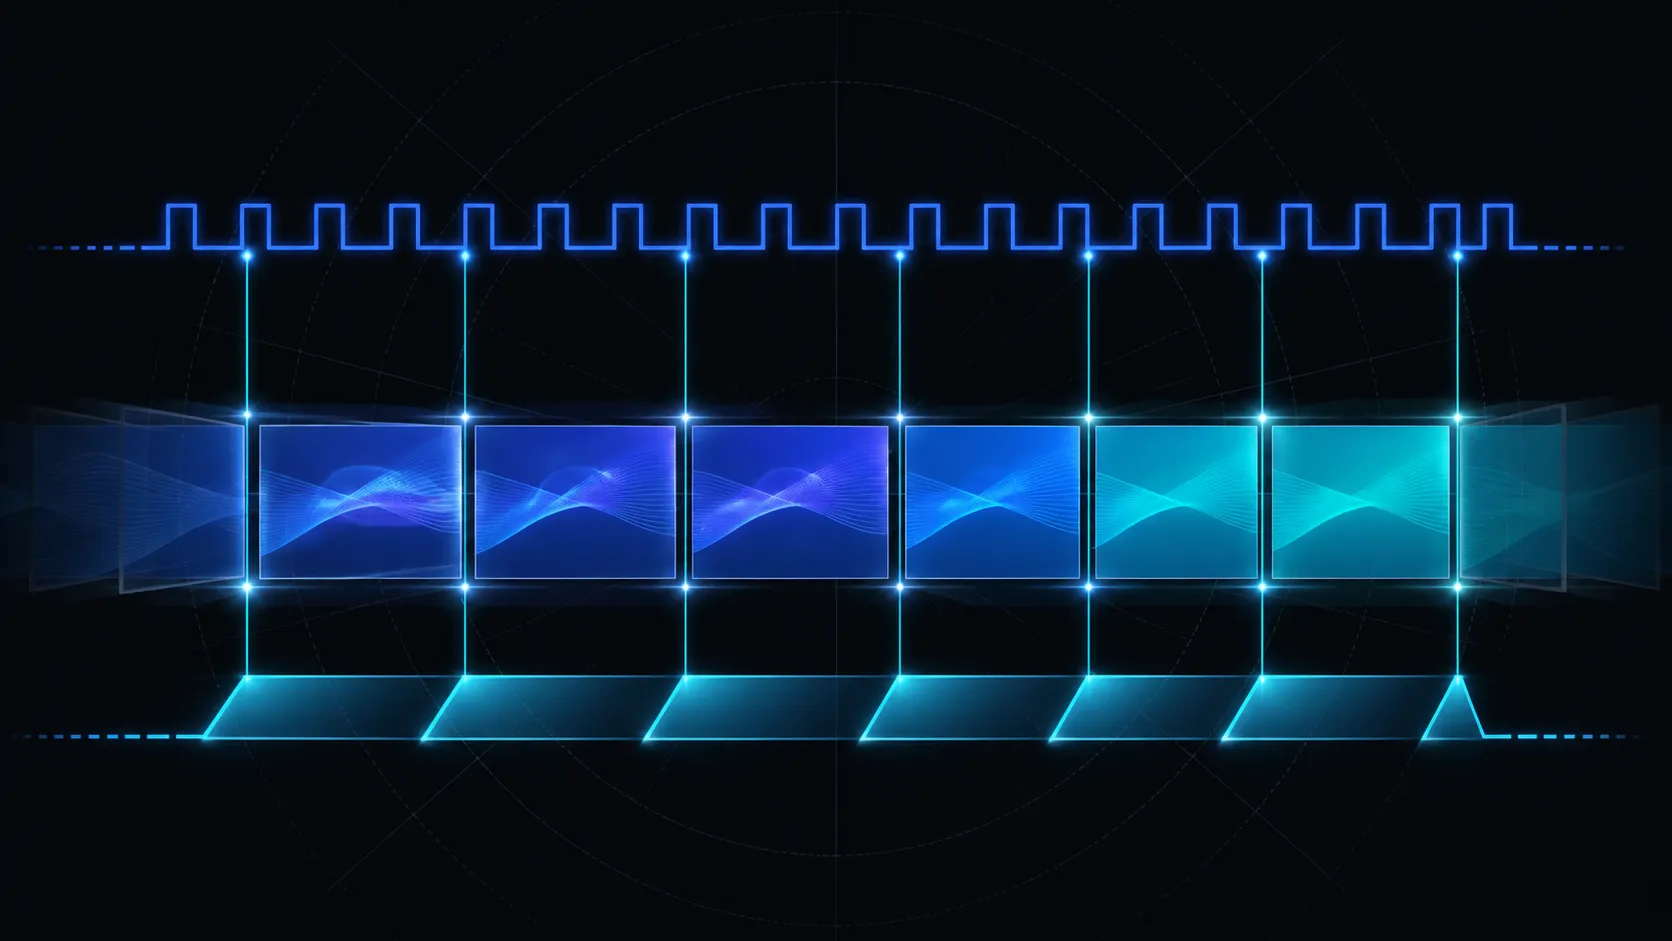
Genlock establishes timing agreement around a reference. That helps a professional system avoid independent timing behaviour among equipment expected to act together. Frame Lock tackles frame coordination where the visual architecture crosses graphics processors.
These are concrete functions, but neither is a millisecond value. A system can be synchronized and still have an end-to-end delay shaped by content production, application processing and displays. A buyer should therefore write two separate acceptance lines: one for coordination and another for responsiveness.
Draw the timing path
Identify the reference relationship and every participating device or output group. Then mark the points at which imagery changes ownership between GPUs. This diagram tells the commissioning team where to observe coordination without pretending to define an exact connection recipe for every installation.
🧪 Create a latency test that matches the use
Choose the event whose delay matters: an operator input, a source change or a visual response in the application. Define where the measurement begins and ends. The chosen threshold should reflect the broadcast, simulation or visualization task rather than a generic marketing word.
Repeat the observation under representative operating conditions. Record the application state, active GPU allocation and display mode. Comparing like with like is essential when a configuration change is assessed.
Buying the PNY RTX Pro Sync card requires R19,599; that figure covers coordination hardware rather than a guaranteed response-time result.
🧠 Plan the multi-GPU boundary
PNY limits the architecture to eight NVIDIA RTX Pro processors. Assign applications and output groups across that graphics layer, then concentrate Frame Lock testing on the boundaries between them.
Compare professional processors through Evetech's workstation graphics card category once the workload distribution is known. Processor quantity should follow actual rendering and output needs, not the maximum the card permits.
Keep canvas arrangement separate
The canvas role belongs to NVIDIA Mosaic. It can help form the intended visual arrangement, but it does not supply a latency measurement or replace the lock roles. The three functions should retain separate pass conditions.
🖥️ Measure across the intended screens
The PNY card supports up to 32 synchronised displays. Test the screen groups and viewing positions that matter to the project rather than validating only one convenient centre panel. Moving edges and synchronized scene changes can expose coordination problems, while the separate latency procedure measures response.
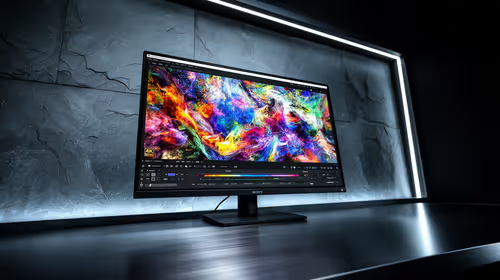
Use Evetech's PC monitor range to compare the display layer against the room and application requirements. Screen behaviour remains part of the end-to-end measurement, not something inferred from the sync card.
Select relevant graphics card accessories only after the architecture and test points are fixed. This helps preserve the measurement path when supporting parts are added.
Separate two result sheets
The synchronization sheet should record whether the timing and frame relationships behave as intended across the relevant outputs. The latency sheet should record the chosen event, start point, end point and measured outcome. Keeping the sheets separate prevents a pass in one category from being mistaken for a pass in the other.
Include the active Mosaic layout and GPU ownership on both sheets. A change in canvas or processor allocation can alter the path being observed, even when the measurement method appears identical. Comparisons are meaningful only when their context is preserved.
Check repeatability before interpreting a number
Run the same latency procedure several times under the representative workload. If the result varies, inspect the test setup and operating state before drawing a conclusion. A single reading may describe one moment rather than the system the project will actually use.
For the coordination test, replay the same moving edge or synchronized transition after a controlled restart. A professional installation should be able to return to its accepted state with documented steps, not depend on an unrecorded adjustment.
Locate faults by their movement
A symptom that follows a content region may begin in the application path. One that stays at a GPU boundary directs attention toward frame coordination, while a broader disagreement among equipment may involve the timing reference. A problem fixed to one panel position belongs in a different branch of the investigation.
These observations are starting points rather than automatic diagnoses. Use one controlled change and repeat the original test. Retain the last known passing state so an unsuccessful adjustment can be reversed cleanly.
Scale the measurement with the wall
When another GPU or display group joins the system, extend both result sheets. Add the new boundary, identify the content that will cross it and decide whether the previous endpoints still describe the important latency path. Do not assume a smaller test represents the expanded visual environment.
The card's eight-GPU and 32-screen ceilings define the largest supported architecture. Every stage below them still deserves the specific synchronization and responsiveness evidence needed by its workload.
Explain the result without overselling it
Report what was tested, under which operating conditions and what passed. Avoid turning one configuration's latency into a permanent product-wide number. The useful conclusion is that the completed design met its agreed threshold during a repeatable procedure.
Scale reaches eight GPUs and two sync cards, with 32 displays or projectors available through Mosaic. No measured end-to-end latency accompanies that capacity, so the title's latency component still requires a complete installation test. The box includes four 12-inch and two 24-inch sync leads, allowing the test architecture to be wired with documented cable lengths.
Record that measured latency with the signal path, refresh configuration and exact test content attached.
Frequently Asked Questions
Does PNY RTX Pro Sync have a guaranteed latency number?
No fixed latency result accompanies the card. Define the start and end points, then measure the completed system for the intended workflow.
What can be said about Genlock?
It aligns relevant equipment to a timing reference, providing a clear coordination role without implying a particular delay.
What does Frame Lock contribute?
It coordinates frames across participating graphics resources, making it relevant where visual output spans GPU boundaries.
Does Mosaic reduce latency?
For the canvas, Mosaic supplies the arranged multi-display role. Any responsiveness requirement needs its own end-to-end measurement.
What capacity is supported?
At its largest, the architecture has an eight-GPU RTX Pro layer serving 32 synchronised displays.
What belongs in a useful latency report?
State the event being measured, the exact start and end points, the operating workload, active GPU allocation and display mode. Include repeated results rather than one isolated reading. Keep the synchronization outcome on a separate line so readers know whether the report demonstrates coordination, responsiveness or both. Add the date and configuration owner, giving a later measurement a reliable point of comparison after maintenance. Retain the test method with the report.
Identify the observer or measurement owner as well.
Ready to measure synchronization and latency separately?
Build the two acceptance tests first, then compare Evetech's professional graphics and display categories against the complete signal plan.