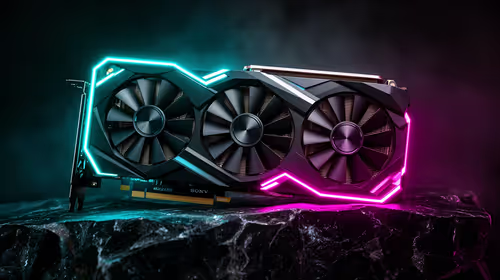
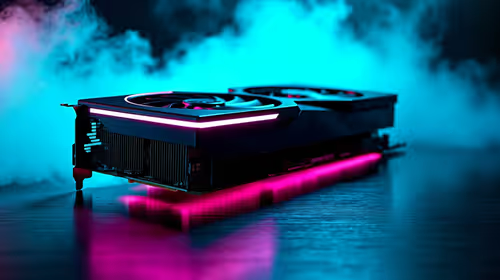
A long render is not proof that the graphics card is the bottleneck. Scene preparation, unsupported execution paths, graphics memory, CPU work and storage can each delay a different stage. Solving a rendering bottleneck begins by timing the pipeline in parts and selecting hardware only after the constrained step is visible.
Quick Answer
The RTX A1000 can address supported rendering stages through 2,304 CUDA cores and separate groups of 18 RT and 72 Tensor units. Its 8GB GDDR6 memory moves data at 192GB/sec.
Time the rendering pipeline in parts, verify GPU device selection and change one condition after the baseline. PNY's A1000 is priced at R12,099. The card offers 2304 CUDA cores on Ampere for supported compute, while scene data has 8GB GDDR6 and a 128-bit interface. Relevance depends on the renderer and production scene.
🧭 Split the render into stages
Measure scene loading, preparation, compilation, the render itself and output writing separately where the software allows. A slow start followed by a fast compute phase points to a different issue from a render that spends most of its duration on GPU-supported work.
Save the test scene and note the renderer version, device selection, resolution, samples and effects. A repeatable baseline prevents a driver, software or setting change from being mistaken for a hardware improvement.
🧭 Confirm the accelerated path
Check that the renderer supports the intended NVIDIA GPU route and has selected the correct device. CUDA cores are useful only when the software can schedule suitable work on them. The A1000 provides 2304 such cores within Ampere architecture, but no render time follows from the count.
Run a small diagnostic scene to verify basic device use, then repeat the production scene. If the program falls back to another path or cannot use a required feature, replacing the GPU with a similar unsupported option will not fix the bottleneck.
🧭 Check whether the scene fits
Geometry, textures and other render data use graphics memory. The A1000 has 8GB GDDR6 served by a 128-bit interface. Watch the difficult scene for memory warnings or behaviour changes, and compare it with a smaller controlled version.
When the evidence identifies a graphics constraint, use Evetech's workstation graphics card range to compare capacity and compute. The R12,099 RTX A1000 is one complete configuration to test, not an automatic rendering result.
🧭 Protect the whole production path
Rendering can still wait for CPU preparation, system RAM or storage. Observe those resources during the same timed stages. Spending on a graphics card while the job is blocked elsewhere simply moves budget without moving the deadline.
If the pipeline includes AI denoising or other model-based steps, inspect their support separately. The AI PC section helps when the requirement becomes platform-wide. Keep each feature tied to a measured stage so "AI" does not become a vague reason for replacing everything.
Decide whether to optimise the scene or the hardware
A scene may contain assets that no longer contribute to the final frame. Removing genuinely unused geometry or right-sizing textures can improve production hygiene on every GPU. Keep these changes separate from reductions that damage the required output.
After cleaning the scene, rerun the timed stages. If the remaining production file still exposes a graphics limit, the hardware case is stronger. If the bottleneck disappears, retain the optimised project and avoid spending merely to preserve waste.
The comparison should use both the original and cleaned versions once, so the team understands whether process, hardware or both created the delay.
Render queues also need scheduling context. A task that runs unattended overnight may have a different acceptable duration from an interactive preview needed every few minutes. Set separate targets for each.
This prevents the team from overpaying to shorten a non-critical batch while leaving the interactive bottleneck untouched. Time matters only relative to the production schedule it serves.
Those resources have distinct ceilings. Standard FP32 work reaches 6.74 TFLOPS; the ray-tracing path reaches 13.2 TFLOPS; Tensor processing is rated as high as 53.8 TFLOPS. A renderer that maps work to one of those paths may benefit, while a CPU-bound preparation or undersized system-memory stage will not be fixed by the card alone. The diagnostic sequence should identify which engine is active and whether the scene fits within the 8GB allocation.
Frequently Asked Questions
What is the first bottleneck check?
Time the render pipeline in stages and confirm the device selected by the renderer. This distinguishes preparation delays from GPU-supported compute work.
Why verify renderer support before buying?
A card's CUDA resources help only if the application and chosen render mode can use them. Support is a gate before performance.
How does 8GB enter diagnosis?
The scene's active data must fit within practical graphics-memory capacity. Observe required production files rather than inferring the answer from a small sample.
Will 2304 CUDA cores guarantee a faster render?
No. Scene, settings, renderer implementation, memory and other workstation components all affect completion time.
Ready to trace a render delay to the stage that causes it?
Measure the pipeline first, then compare Evetech professional GPUs against the renderer, scene and capacity requirement you uncover.